SGR DrawMap-EN : Différence entre versions
De BlueWiki
(→Parameters) |
(→Code example) |
||
| (Une révision intermédiaire par un utilisateur est masquée) | |||
| Ligne 94 : | Ligne 94 : | ||
| − | |||
| − | |||
| − | |||
// Method : Exemple_carte1 | // Method : Exemple_carte1 | ||
// Description | // Description | ||
| Ligne 104 : | Ligne 101 : | ||
// ---------------------------------------------------- | // ---------------------------------------------------- | ||
| − | + | ARRAY TEXT($DataGrapheName;0) | |
| − | + | ARRAY TEXT($DataGraphe;0) | |
| − | + | APPEND TO ARRAY($DataGrapheName;"Title") | |
| − | + | APPEND TO ARRAY($DataGraphe;"Répartition géographique des ventes") // 1 - Titre du graphe | |
| − | + | APPEND TO ARRAY($DataGrapheName;"SVGFile") | |
| − | + | APPEND TO ARRAY($DataGraphe;"Fond_de_carte_France"+Folder separator+"departements.svg") | |
| − | + | APPEND TO ARRAY($DataGrapheName;"GraphFont") | |
| − | + | APPEND TO ARRAY($DataGraphe;"Arial") // Police des légendes et des échelles | |
| − | + | APPEND TO ARRAY($DataGrapheName;"GraphBGColor") | |
| − | + | APPEND TO ARRAY($DataGraphe;"LightBlue:30") // Couleur du fond | |
| − | + | APPEND TO ARRAY($DataGrapheName;"ShowLegend") | |
| − | + | APPEND TO ARRAY($DataGraphe;"Oui") // Affichage de la légende | |
| − | + | APPEND TO ARRAY($DataGrapheName;"LegendLanguage") | |
| − | + | APPEND TO ARRAY($DataGraphe;"English") // Affichage de la légende | |
| − | + | ARRAY REAL($valeur_limite;3) | |
$valeur_limite{1}:=30 | $valeur_limite{1}:=30 | ||
$valeur_limite{2}:=60 | $valeur_limite{2}:=60 | ||
$valeur_limite{3}:=90 | $valeur_limite{3}:=90 | ||
| − | + | ARRAY TEXT($couleur;3) | |
$couleur{0}:="aquamarine" | $couleur{0}:="aquamarine" | ||
$couleur{1}:="deepskyblue" | $couleur{1}:="deepskyblue" | ||
| Ligne 135 : | Ligne 132 : | ||
$couleur{3}:="midnightblue" | $couleur{3}:="midnightblue" | ||
| − | + | ARRAY REAL($Value;95) | |
| − | + | ARRAY TEXT($ZoneID;95) | |
| − | + | For ($i;1;95) | |
| − | $ZoneID{$i}:= | + | $ZoneID{$i}:=String($i;"00") |
| − | $Value{$i}:=( | + | $Value{$i}:=(Random%(101)) |
| − | + | End for | |
$ZoneID{20}:="2A" | $ZoneID{20}:="2A" | ||
| − | + | INSERT IN ARRAY($ZoneID;21;1) | |
$ZoneID{21}:="2B" | $ZoneID{21}:="2B" | ||
| − | + | INSERT IN ARRAY($Value;21;1) | |
$Value{21}:=$Value{20} | $Value{21}:=$Value{20} | ||
TheGraphe:=SGR_DrawMap (->$DataGrapheName;->$DataGraphe;->$valeur_limite;->$couleur;->$ZoneID;->$Value) | TheGraphe:=SGR_DrawMap (->$DataGrapheName;->$DataGraphe;->$valeur_limite;->$couleur;->$ZoneID;->$Value) | ||
| − | |||
| − | |||
| − | |||
| − | |||
Version actuelle en date du 2 juillet 2014 à 20:42
Component Command List - Version française
[modifier] Parameters
[modifier] Description
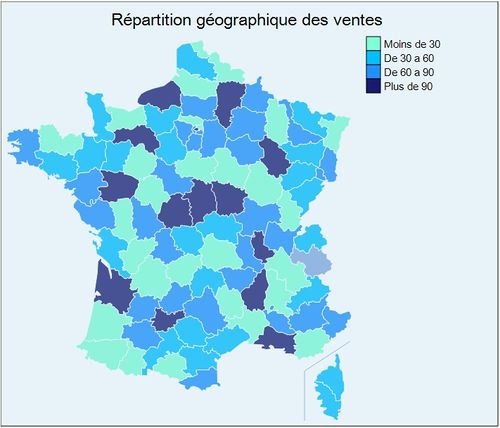
This command allows colorizing a base map function of values and color gradients.
Zones are listed by their ID and manipulated from thereof.
[modifier] Code example
 // Method : Exemple_carte1
 // Description
 //
 //
 // Parameters
 // ----------------------------------------------------

ARRAY TEXT($DataGrapheName;0)
ARRAY TEXT($DataGraphe;0)
APPEND TO ARRAY($DataGrapheName;"Title")
APPEND TO ARRAY($DataGraphe;"Répartition géographique des ventes")  // 1 - Titre du graphe

APPEND TO ARRAY($DataGrapheName;"SVGFile")
APPEND TO ARRAY($DataGraphe;"Fond_de_carte_France"+Folder separator+"departements.svg")

APPEND TO ARRAY($DataGrapheName;"GraphFont")
APPEND TO ARRAY($DataGraphe;"Arial")  // Police des légendes et des échelles

APPEND TO ARRAY($DataGrapheName;"GraphBGColor")
APPEND TO ARRAY($DataGraphe;"LightBlue:30")  // Couleur du fond

APPEND TO ARRAY($DataGrapheName;"ShowLegend")
APPEND TO ARRAY($DataGraphe;"Oui")  // Affichage de la légende

APPEND TO ARRAY($DataGrapheName;"LegendLanguage")
APPEND TO ARRAY($DataGraphe;"English")  // Affichage de la légende

ARRAY REAL($valeur_limite;3)
$valeur_limite{1}:=30
$valeur_limite{2}:=60
$valeur_limite{3}:=90

ARRAY TEXT($couleur;3)
$couleur{0}:="aquamarine"
$couleur{1}:="deepskyblue"
$couleur{2}:="dodgerblue"
$couleur{3}:="midnightblue"

ARRAY REAL($Value;95)
ARRAY TEXT($ZoneID;95)
For ($i;1;95)
$ZoneID{$i}:=String($i;"00")
$Value{$i}:=(Random%(101))
End for
$ZoneID{20}:="2A"
INSERT IN ARRAY($ZoneID;21;1)
$ZoneID{21}:="2B"
INSERT IN ARRAY($Value;21;1)
$Value{21}:=$Value{20}

TheGraphe:=SGR_DrawMap (->$DataGrapheName;->$DataGraphe;->$valeur_limite;->$couleur;->$ZoneID;->$Value)
