SGR Generate bubbleChart-EN : Différence entre versions
De BlueWiki
| (9 révisions intermédiaires par un utilisateur sont masquées) | |||
| Ligne 1 : | Ligne 1 : | ||
| − | [[Composant_Graphe_SVG-EN#Commands|Component Command List ]] | + | [[Composant_Graphe_SVG-EN#Commands|Component Command List ]] - [[File:icon_drapeau_francais.gif]] [[SGR_Generate_bubbleChart|Version française]] |
| − | + | ||
| − | [[SGR_Generate_bubbleChart|Version française]] | + | |
=== Parameters === | === Parameters === | ||
---- | ---- | ||
| Ligne 23 : | Ligne 21 : | ||
| − | + | '''Graph parameters''' | |
| − | + | ||
| − | + | ||
| − | + | ||
| − | + | ||
| − | + | ||
| − | + | ||
| − | + | ||
| − | + | ||
| − | + | ||
* - "BubbleMaxDiameter" : Maximum diameter of a bubble | * - "BubbleMaxDiameter" : Maximum diameter of a bubble | ||
* - "ShowZeroOnHorizontalAxis" : zero of the X axis should be visible | * - "ShowZeroOnHorizontalAxis" : zero of the X axis should be visible | ||
| Ligne 40 : | Ligne 29 : | ||
* - "ShowBubbleName" : Display bubbles labels | * - "ShowBubbleName" : Display bubbles labels | ||
* - "BubbleFontSize" : bubbles labels font size | * - "BubbleFontSize" : bubbles labels font size | ||
| + | |||
| + | |||
| + | '''General parameters of the graph'''* “GraphFont” or “Police du graphe” :title font and default font for legend and scale (arial by default) | ||
| + | * “GraphBGColor” or “Couleur de fond du graphe”:background color of the graph | ||
| + | * “GraphBGColor2” or “Couleur 2 de fond du graphe”: second background color of the graph. If you specifiy a second color and if it different from the first one, you will obtain a gradation. | ||
| + | |||
| + | |||
| + | '''Title parameters''' | ||
| + | * "Titre" or "Title" : graph title | ||
| + | * "alignement du titre" ou "TitleAlignement" : Title Alignment 0,1,2,3 | ||
| + | * "TitleFontSize" ou "Taille de la police du titre" : Title font size | ||
| + | * "TitleFontStyle" ou "Style de la police du titre" : Title font style (ex (bold+italic)) | ||
| + | * "TitleFontColor" ou "Couleur de la police du titre" : Title font color | ||
| + | * “TitleVerticalOffSet” or “Décalage vertical du titre” :vertical offset in px for an ajustment end of its position | ||
| + | |||
| + | |||
| + | '''Legend parameters''' | ||
| + | * “ShowLegend” or “Affichage de la legend”:display of the legend “oui”, “yes”, “vrai”, “true”, “non”, “no”, “faux”, “false” | ||
| + | * “LegendFont” or “Police de la legend” legend font, if this value is passed, it replaces the graph font | ||
| + | * “LegendFontSize” or “Taille de la police de la légende” :size of legend font | ||
| + | * “LegendFontStyle” or “Style de la police de la légende” :style of the legend font. | ||
| + | * “LegendFontColor”: or “Couleur de la police de la légende” :color of the legend font. | ||
| + | * “LegendBGcolor” or “Couleur de fond de la légende” :color of the background of legend rectangle (“White:0” for transparency) | ||
|- | |- | ||
| Ligne 53 : | Ligne 65 : | ||
|valign="top"|[[File:in.png|caption]] | |valign="top"|[[File:in.png|caption]] | ||
|valign="top" align="center"|3 | |valign="top" align="center"|3 | ||
| − | | | + | |Pointer to a array (text) of name bubbles |
|- | |- | ||
Version actuelle en date du 8 juillet 2014 à 08:34
Component Command List - ![]() Version française
Version française
[modifier] Parameters
[modifier] Description
[modifier] Sample Code
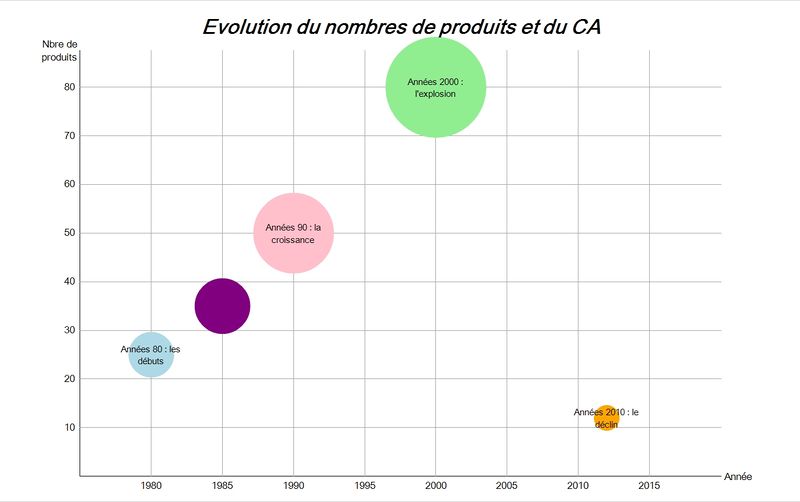
Pour obtenir ce graphe il vous faudra utiliser le code ci-dessous
 // User (OS) : Paul Kuhn - BlueCompany
 // ----------------------------------------------------
 // Method : Exemple_Bulle
 // Description
 //
 //
 // Parameters
 // ----------------------------------------------------
ARRAY TEXT($DataGrapheName;0)
ARRAY TEXT($DataGraphe;0)
APPEND TO ARRAY($DataGrapheName;"BubbleMaxDiameter")
APPEND TO ARRAY($DataGraphe;"400")  // diametre maximum d'une bulle
APPEND TO ARRAY($DataGrapheName;"GraphBGColor")
APPEND TO ARRAY($DataGraphe;"White")  // couleur de fond du graphe
APPEND TO ARRAY($DataGrapheName;"Title")
APPEND TO ARRAY($DataGraphe;"Evolution du nombres de produits et du CA")  // Titre du graphe
APPEND TO ARRAY($DataGrapheName;"TitleAlignement")
APPEND TO ARRAY($DataGraphe;String(Center))  // Alignement du Titre du graphe
APPEND TO ARRAY($DataGrapheName;"ShowZeroOnHorizontalAxis")
APPEND TO ARRAY($DataGraphe;"non")  // le zéro de l'axe horizontal doit etre visible
APPEND TO ARRAY($DataGrapheName;"ShowZeroOnVerticalAxis")
APPEND TO ARRAY($DataGraphe;"oui")  // le zéro de l'axe vertical doit etre visible
APPEND TO ARRAY($DataGrapheName;"ShowHorizontalScaleLine")
APPEND TO ARRAY($DataGraphe;"oui")  // Traits horizontaux pour les graduations
APPEND TO ARRAY($DataGrapheName;"ShowVerticalScaleLine")
APPEND TO ARRAY($DataGraphe;"yes")  // Traits verticaux pour les graduations
APPEND TO ARRAY($DataGrapheName;"ShowBubbleName")
APPEND TO ARRAY($DataGraphe;"oui")  // Affichage des libellés
APPEND TO ARRAY($DataGrapheName;"BubbleFontSize")
APPEND TO ARRAY($DataGraphe;"36")  // taille de la police des libellés
APPEND TO ARRAY($DataGrapheName;"GraphFont")
APPEND TO ARRAY($DataGraphe;"Arial")  // Police des légendes et des échelles
APPEND TO ARRAY($DataGrapheName;"BubbleStyle")
APPEND TO ARRAY($DataGraphe;"Sphere")  // Type de bulle à dessiner

ARRAY TEXT($legende;0)  // légende des valeurs
APPEND TO ARRAY($legende;"Année")
APPEND TO ARRAY($legende;"Nbre de produits")
APPEND TO ARRAY($legende;"CA")

ARRAY TEXT($Libelle;0)
APPEND TO ARRAY($Libelle;"Années 80 : les débuts")
APPEND TO ARRAY($Libelle;"")
APPEND TO ARRAY($Libelle;"Années 90 : la croissance")
APPEND TO ARRAY($Libelle;"Années 2000 : l'explosion")
APPEND TO ARRAY($Libelle;"Années 2010 : le déclin")

ARRAY REAL($Value1;0)  // axe horizontal
APPEND TO ARRAY($Value1;1980)
APPEND TO ARRAY($Value1;1985)
APPEND TO ARRAY($Value1;1990)
APPEND TO ARRAY($Value1;2000)
APPEND TO ARRAY($Value1;2012)

ARRAY REAL($Value2;0)  // axe vertical
APPEND TO ARRAY($Value2;25)
APPEND TO ARRAY($Value2;35)
APPEND TO ARRAY($Value2;50)
APPEND TO ARRAY($Value2;80)
APPEND TO ARRAY($Value2;12)

ARRAY REAL($Value3;0)  // Diametre de la bulle
APPEND TO ARRAY($Value3;18000000)
APPEND TO ARRAY($Value3;22000000)
APPEND TO ARRAY($Value3;32000000)
APPEND TO ARRAY($Value3;40000000)
APPEND TO ARRAY($Value3;10000000)

ARRAY TEXT($Color;0)
APPEND TO ARRAY($Color;"lightblue")
APPEND TO ARRAY($Color;"Purple")
APPEND TO ARRAY($Color;"Pink")
APPEND TO ARRAY($Color;"LightGreen")
APPEND TO ARRAY($Color;"orange")

TheGraphe:=SGR_Generate_bubbleChart (->$DataGrapheName;->$DataGraphe;->$legende;->$Libelle;->$Value1;->$Value2;->$Value3;->$Color)
