SGR Generate TableFromArray-EN : Différence entre versions
De BlueWiki
(→Parameters) |
|||
| Ligne 19 : | Ligne 19 : | ||
Possible values of the parameter of the graph are the following: | Possible values of the parameter of the graph are the following: | ||
| + | |||
| + | |||
| + | General parameters of the graph | ||
| + | * "GraphBGColor" ou "Couleur de fond du graphe" : Background color of the table | ||
| + | * "GraphBGColor2" ou "Couleur 2 de fond du graphe" : Second background color of the graph, if you specify a second color which is different from the first you will get a gradient | ||
| + | * "GraphBorderColor" ou "Couleur de bord du graphe" : Color of the line to the edge of the table | ||
| + | * "Police du graphe" ou "GraphFont" : Title font and default font | ||
| + | * "CellMargin" ou "Marge interne des cellules" : Cell padding | ||
| + | |||
Title parameters | Title parameters | ||
| Ligne 28 : | Ligne 37 : | ||
* "TitleFontColor" ou "Couleur de la police du titre" : Title font color | * "TitleFontColor" ou "Couleur de la police du titre" : Title font color | ||
* "TitleVerticalOffSet" or "Décalage vertical du titre" : Vertical offset in px for fine adjustment of its position | * "TitleVerticalOffSet" or "Décalage vertical du titre" : Vertical offset in px for fine adjustment of its position | ||
| − | |||
| − | |||
| − | |||
| − | |||
| − | |||
| − | |||
Version du 2 juillet 2014 à 20:26
Component Command List - Version française
Parameters
Description
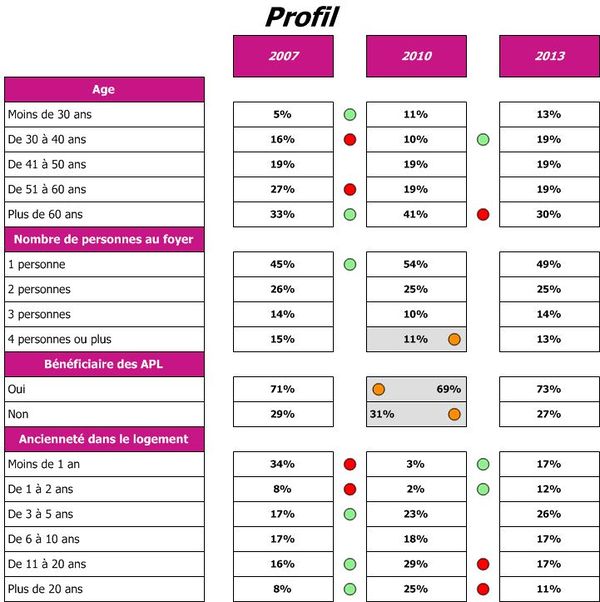
This command provides the image of a formatted table.
Code Example
For this formatted table you should use the code below
 // Nom utilisateur (OS) : Paul Kuhn - BlueCompany
 // Date et heure : 23/12/13, 21:41:15
 // ----------------------------------------------------
 // Méthode : Exemple_Array1

C_PICTURE($rondVert)
$svgRef:=SVG_New
$objectRef:=SVG_New_circle ($svgRef;10;10;7;"Black";"Lightgreen";1)
$rondVert:=SVG_Export_to_picture ($svgRef)
SVG_CLEAR ($svgRef)

C_PICTURE($rondrouge)
$svgRef:=SVG_New
$objectRef:=SVG_New_circle ($svgRef;10;10;7;"Black";"red";1)
$rondrouge:=SVG_Export_to_picture ($svgRef)
SVG_CLEAR ($svgRef)

C_PICTURE($rondorange)
$svgRef:=SVG_New
$objectRef:=SVG_New_circle ($svgRef;10;10;7;"Black";"darkorange";1)
$rondorange:=SVG_Export_to_picture ($svgRef)
SVG_CLEAR ($svgRef)


ARRAY TEXT($DataGrapheName;0)
ARRAY TEXT($DataGraphe;0)
APPEND TO ARRAY($DataGrapheName;"Title")
APPEND TO ARRAY($DataGraphe;"Profil")  // Titre du graphe

APPEND TO ARRAY($DataGrapheName;"GraphBGColor")
APPEND TO ARRAY($DataGraphe;"White")  // Couleur du fond

APPEND TO ARRAY($DataGrapheName;"GraphBorderColor")
APPEND TO ARRAY($DataGraphe;"White")  //Cadre au tour du graph

APPEND TO ARRAY($DataGrapheName;"GraphFont")
APPEND TO ARRAY($DataGraphe;"Tahoma")  // Police de base du tableau

APPEND TO ARRAY($DataGrapheName;"TitleAlignement")
APPEND TO ARRAY($DataGraphe;String(Center))  // Alignement du Titre du graphe

APPEND TO ARRAY($DataGrapheName;"TitleFontSize")
APPEND TO ARRAY($DataGraphe;"32")  // Alignement du Titre du graphe


ARRAY TEXT($LayoutArray;6;21)

If (True)  // Line title
ARRAY TEXT($LineTitle;0)
ARRAY REAL($LineHeight;0)

$LineHeight{0}:=50
APPEND TO ARRAY($LineTitle;"Age")
APPEND TO ARRAY($LineHeight;30)
$LayoutArray{0}{1}:="background=mediumvioletred&align=center&fontcolor=white&Fontsize=14&Style=1"

APPEND TO ARRAY($LineTitle;"Moins de 30 ans")
APPEND TO ARRAY($LineHeight;30)

APPEND TO ARRAY($LineTitle;"De 30 à 40 ans")
APPEND TO ARRAY($LineHeight;30)

APPEND TO ARRAY($LineTitle;"De 41 à 50 ans")
APPEND TO ARRAY($LineHeight;30)

APPEND TO ARRAY($LineTitle;"De 51 à 60 ans")
APPEND TO ARRAY($LineHeight;30)

APPEND TO ARRAY($LineTitle;"Plus de 60 ans")
APPEND TO ARRAY($LineHeight;30)
APPEND TO ARRAY($LineTitle;"Nombre de personnes au foyer")
APPEND TO ARRAY($LineHeight;30)
$LayoutArray{0}{7}:="background=mediumvioletred&align=center&fontcolor=white&Fontsize=14&Style=1"

APPEND TO ARRAY($LineTitle;"1 personne")
APPEND TO ARRAY($LineHeight;30)

APPEND TO ARRAY($LineTitle;"2 personnes")
APPEND TO ARRAY($LineHeight;30)

APPEND TO ARRAY($LineTitle;"3 personnes")
APPEND TO ARRAY($LineHeight;30)

APPEND TO ARRAY($LineTitle;"4 personnes ou plus")
APPEND TO ARRAY($LineHeight;30)

APPEND TO ARRAY($LineTitle;"Bénéficiaire des APL")
APPEND TO ARRAY($LineHeight;30)
$LayoutArray{0}{12}:="background=mediumvioletred&align=center&fontcolor=white&Fontsize=14&Style=1"

APPEND TO ARRAY($LineTitle;"Oui")
APPEND TO ARRAY($LineHeight;30)

APPEND TO ARRAY($LineTitle;"Non")
APPEND TO ARRAY($LineHeight;30)

APPEND TO ARRAY($LineTitle;"Ancienneté dans le logement")
APPEND TO ARRAY($LineHeight;30)
$LayoutArray{0}{15}:="background=mediumvioletred&align=center&fontcolor=white&Fontsize=14&Style=1"

APPEND TO ARRAY($LineTitle;"Moins de 1 an")
APPEND TO ARRAY($LineHeight;30)

APPEND TO ARRAY($LineTitle;"De 1 à 2 ans")
APPEND TO ARRAY($LineHeight;30)

APPEND TO ARRAY($LineTitle;"De 3 à 5 ans")
APPEND TO ARRAY($LineHeight;30)

APPEND TO ARRAY($LineTitle;"De 6 à 10 ans")
APPEND TO ARRAY($LineHeight;30)

APPEND TO ARRAY($LineTitle;"De 11 à 20 ans")
APPEND TO ARRAY($LineHeight;30)

APPEND TO ARRAY($LineTitle;"Plus de 20 ans")
APPEND TO ARRAY($LineHeight;30)
End if

If (True)  // titres de colonnes
ARRAY TEXT($ColumnTitle;0)
ARRAY REAL($ColumnWidth;0)
$ColumnWidth{0}:=250  // largeur colonne de titre de ligne

APPEND TO ARRAY($ColumnTitle;"")
APPEND TO ARRAY($ColumnWidth;30)
$LayoutArray{1}{0}:="border=0"

APPEND TO ARRAY($ColumnTitle;"2007")
APPEND TO ARRAY($ColumnWidth;120)
$LayoutArray{2}{0}:="background=mediumvioletred&align=center&fontcolor=white&Fontsize=14&Style=3"

APPEND TO ARRAY($ColumnTitle;"")
APPEND TO ARRAY($ColumnWidth;40)
$LayoutArray{3}{0}:="border=0"

APPEND TO ARRAY($ColumnTitle;"2010")
APPEND TO ARRAY($ColumnWidth;120)
$LayoutArray{4}{0}:="background=mediumvioletred&align=center&fontcolor=white&Fontsize=14&Style=3"

APPEND TO ARRAY($ColumnTitle;"")
APPEND TO ARRAY($ColumnWidth;40)
$LayoutArray{5}{0}:="border=0"

APPEND TO ARRAY($ColumnTitle;"2013")
APPEND TO ARRAY($ColumnWidth;120)
$LayoutArray{6}{0}:="background=mediumvioletred&align=center&fontcolor=white&Fontsize=14&Style=3"

End if

If (True)  // les valeurs
ARRAY TEXT($ValuesArray;6;21)
  // Age
$ValuesArray{1}{1}:=""
$ValuesArray{2}{1}:=""
$ValuesArray{3}{1}:=""
$ValuesArray{4}{1}:=""
$ValuesArray{5}{1}:=""
$ValuesArray{6}{1}:=""

 // Age -30
$ValuesArray{1}{2}:=""
$ValuesArray{2}{2}:="5%"
$ValuesArray{3}{2}:=""
$ValuesArray{4}{2}:="11%"
$ValuesArray{5}{2}:=""
$ValuesArray{6}{2}:="13%"

 // Age 30-40
$ValuesArray{1}{3}:=""
$ValuesArray{2}{3}:="16%"
$ValuesArray{3}{3}:=""
$ValuesArray{4}{3}:="10%"
$ValuesArray{5}{3}:=""
$ValuesArray{6}{3}:="19%"

 // Age 40-50
$ValuesArray{1}{4}:=""
$ValuesArray{2}{4}:="19%"
$ValuesArray{3}{4}:=""
$ValuesArray{4}{4}:="19%"
$ValuesArray{5}{4}:=""
$ValuesArray{6}{4}:="19%"

 // Age 50-60
$ValuesArray{1}{5}:=""
$ValuesArray{2}{5}:="27%"
$ValuesArray{3}{5}:=""
$ValuesArray{4}{5}:="19%"
$ValuesArray{5}{5}:=""
$ValuesArray{6}{5}:="19%"

 // Age 50-60
$ValuesArray{1}{6}:=""
$ValuesArray{2}{6}:="33%"
$ValuesArray{3}{6}:=""
$ValuesArray{4}{6}:="41%"
$ValuesArray{5}{6}:=""
$ValuesArray{6}{6}:="30%"


 // 1p
$ValuesArray{2}{8}:="45%"
$ValuesArray{4}{8}:="54%"
$ValuesArray{6}{8}:="49%"
 // 2p
$ValuesArray{2}{9}:="26%"
$ValuesArray{4}{9}:="25%"
$ValuesArray{6}{9}:="25%"
 // 3p
$ValuesArray{2}{10}:="14%"
$ValuesArray{4}{10}:="10%"
$ValuesArray{6}{10}:="14%"
 // 4p+
$ValuesArray{2}{11}:="15%"
$ValuesArray{4}{11}:="11%"
$ValuesArray{6}{11}:="13%"


 // Yes
$ValuesArray{2}{13}:="71%"
$ValuesArray{4}{13}:="69%"
$ValuesArray{6}{13}:="73%"
 // no
$ValuesArray{2}{14}:="29%"
$ValuesArray{4}{14}:="31%"
$ValuesArray{6}{14}:="27%"


 // -1
$ValuesArray{2}{16}:="34%"
$ValuesArray{4}{16}:="3%"
$ValuesArray{6}{16}:="17%"
 // 1-2
$ValuesArray{2}{17}:="8%"
$ValuesArray{4}{17}:="2%"
$ValuesArray{6}{17}:="12%"
 // 3-5
$ValuesArray{2}{18}:="17%"
$ValuesArray{4}{18}:="23%"
$ValuesArray{6}{18}:="26%"
 // 6-10
$ValuesArray{2}{19}:="17%"
$ValuesArray{4}{19}:="18%"
$ValuesArray{6}{19}:="17%"
 // 10-20
$ValuesArray{2}{20}:="16%"
$ValuesArray{4}{20}:="29%"
$ValuesArray{6}{20}:="17%"
 // +20
$ValuesArray{2}{21}:="8%"
$ValuesArray{4}{21}:="25%"
$ValuesArray{6}{21}:="11%"
End if
If (True)  // les symboles
ARRAY PICTURE($PictureArray;6;21)
$PictureArray{4}{11}:=$rondorange
$PictureArray{4}{13}:=$rondorange
$PictureArray{4}{14}:=$rondorange

$PictureArray{3}{2}:=$rondVert

$PictureArray{3}{3}:=$rondrouge
$PictureArray{5}{3}:=$rondVert
$PictureArray{3}{5}:=$rondrouge
$PictureArray{3}{6}:=$rondVert
$PictureArray{5}{6}:=$rondrouge

$PictureArray{3}{8}:=$rondVert

$PictureArray{3}{16}:=$rondrouge
$PictureArray{5}{16}:=$rondVert
$PictureArray{3}{17}:=$rondrouge
$PictureArray{5}{17}:=$rondVert
$PictureArray{3}{18}:=$rondVert
$PictureArray{3}{20}:=$rondVert
$PictureArray{5}{20}:=$rondrouge
$PictureArray{3}{21}:=$rondVert
$PictureArray{5}{21}:=$rondrouge
End if

If (True)  // mise en forme des cellules
ARRAY TEXT($LayoutArray;6;21)
$LayoutArray{1}{1}:="border=0"
$LayoutArray{2}{1}:="border=0"
$LayoutArray{3}{1}:="border=0"
$LayoutArray{4}{1}:="border=0"
$LayoutArray{5}{1}:="border=0"
$LayoutArray{6}{1}:="border=0"

$LayoutArray{1}{7}:="border=0"
$LayoutArray{2}{7}:="border=0"
$LayoutArray{3}{7}:="border=0"
$LayoutArray{4}{7}:="border=0"
$LayoutArray{5}{7}:="border=0"
$LayoutArray{6}{7}:="border=0"

$LayoutArray{1}{12}:="border=0"
$LayoutArray{2}{12}:="border=0"
$LayoutArray{3}{12}:="border=0"
$LayoutArray{4}{12}:="border=0"
$LayoutArray{5}{12}:="border=0"
$LayoutArray{6}{12}:="border=0"

$LayoutArray{1}{15}:="border=0"
$LayoutArray{2}{15}:="border=0"
$LayoutArray{3}{15}:="border=0"
$LayoutArray{4}{15}:="border=0"
$LayoutArray{5}{15}:="border=0"
$LayoutArray{6}{15}:="border=0"


For ($i;1;21)
$LayoutArray{1}{$i}:="border=0&align=center"
$LayoutArray{3}{$i}:="border=0&align=center"
$LayoutArray{5}{$i}:="border=0&align=center"
End for

For ($i;2;6)
$LayoutArray{2}{$i}:="style=1&align=center"
$LayoutArray{4}{$i}:="style=1&align=center"
$LayoutArray{6}{$i}:="style=1&align=center"

$LayoutArray{0}{$i}:="Fontsize=14"
End for

For ($i;8;11)
$LayoutArray{2}{$i}:="style=1&align=center"
$LayoutArray{4}{$i}:="style=1&align=center"
$LayoutArray{6}{$i}:="style=1&align=center"

$LayoutArray{0}{$i}:="Fontsize=14"
End for

For ($i;13;14)
$LayoutArray{2}{$i}:="style=1&align=center"
$LayoutArray{4}{$i}:="style=1&align=center"
$LayoutArray{6}{$i}:="style=1&align=center"

$LayoutArray{0}{$i}:="Fontsize=14"
End for

For ($i;16;21)
$LayoutArray{2}{$i}:="style=1&align=center"
$LayoutArray{4}{$i}:="style=1&align=center"
$LayoutArray{6}{$i}:="style=1&align=center"

$LayoutArray{0}{$i}:="Fontsize=14"
End for

$LayoutArray{4}{11}:="style=1&align=center&background=lightgrey:75"
$LayoutArray{4}{13}:="style=1&align=right&background=lightgrey:75"
$LayoutArray{4}{14}:="style=1&align=left&background=lightgrey:75"
End if
TheGraphe:=SGR_Generate_TableFromArray (\
->$DataGrapheName;\
->$DataGraphe;\
->$LineTitle;\
->$LineHeight;\
->$ColumnTitle;\
->$ColumnWidth;\
->$ValuesArray;\
->$PictureArray;\
->$LayoutArray)
