Composant Graphe SVG-EN
Sommaire |
General
-> Version française (french version)
The component allows you to generate the following graphs
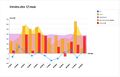
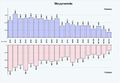
- Bars, stacked bar, proportionals bars
- Area, stacked area, proportionals areas
- Curves
- Points
- Mixed graphs (Area + bar + curve + points)
- Pie graph
- Pyramids
- Kiviat or spiderWeb
- Bubble Graph
- Polar Graph
- Colorized map
- Time Line
The graph generation is done by very simple commands and the component is provided with a base of examples.
On mouse over, you can know the Id of the slected element and be able to display a bubble personalized and somme detailed help.
As this component is still quite young, he is changing rapidly, we are listening to your suggestions for advancing.
Evolution
As this component is still quite young, he is changing rapidly, we are attentive to your ideas to make it progress.
Current version 1.3.5 November 30, 2014
Check Graph Release Notes
Commands
- SGR_Generate_bubbleChart to generate bubblecharts
- SGR_Generate_gauge to generate gauge and thermo
- SGR_Generate_Graph to generate area, bars, curves, mixed graphs or points
- SGR_Generate_Pie to generate pies
- SGR_Generate_PolarGraph to generate polar graphs
- SGR_Generate_Kiviat to generate spiderweb (kiviat)
- SGR_Generate_Pyramid to generate pyramids
- SGR_DrawMap allows to colorized maps or other drawings
- SGR_Generate_TableFromArray lets lay out a table
Utilities
Annexes
Examples
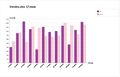
Bars example
Sample bars with display values
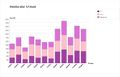
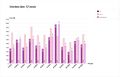
Example of stacked bars
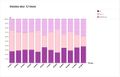
Example of proportional bars
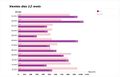
Example of horizontal bars
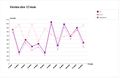
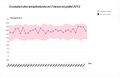
Curve example
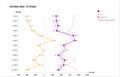
Curve pivoted example
Area example
Area example
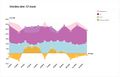
Example of stacked area
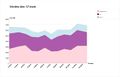
Example of proportional areas
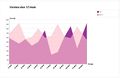
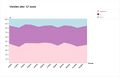
Example of areas of envelopes and a curve
Mixed graph
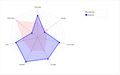
Spiderweb
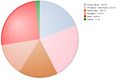
Pie
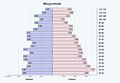
Pyramid
Pyramid

Pyramid
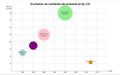
Bubble chart
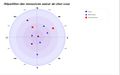
Polar graph
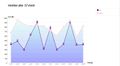
Curve with gradient example
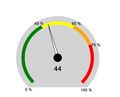
Basic Gauge


