SGR DrawMap-EN : Différence entre versions
De BlueWiki
(→Parameters) |
(→Parameters) |
||
| Ligne 39 : | Ligne 39 : | ||
|- | |- | ||
| − | |valign="top"| | + | |valign="top"|Parameter values of the graph |
|valign="top"|pointeur | |valign="top"|pointeur | ||
|valign="top"|[[File:in.png|caption]] | |valign="top"|[[File:in.png|caption]] | ||
|valign="top" align="center"|2 | |valign="top" align="center"|2 | ||
| − | | | + | |Pointer to the text array of parameter values this array must be the same size as the previous |
|- | |- | ||
| − | |valign="top"| | + | |valign="top"|Limits |
|valign="top"|Pointeur | |valign="top"|Pointeur | ||
|valign="top"|[[File:in.png|caption]] | |valign="top"|[[File:in.png|caption]] | ||
|valign="top" align="center"|3 | |valign="top" align="center"|3 | ||
| − | | | + | |Pointer to the array (real) of limit values of level of values |
|- | |- | ||
| − | |valign="top"| | + | |valign="top"|Colors |
|valign="top"|Pointeur | |valign="top"|Pointeur | ||
|valign="top"|[[File:in.png|caption]] | |valign="top"|[[File:in.png|caption]] | ||
|valign="top" align="center"|4 | |valign="top" align="center"|4 | ||
| − | | | + | |Pointer to the array (text) colors to be applied to the representation, you must define one more color than you have specified limit values |
|- | |- | ||
| Ligne 65 : | Ligne 65 : | ||
|valign="top"|[[File:in.png|caption]] | |valign="top"|[[File:in.png|caption]] | ||
|valign="top" align="center"|5 | |valign="top" align="center"|5 | ||
| − | | | + | |Pointer to the array (text) ID table zones to set color |
|- | |- | ||
| − | |valign="top"| | + | |valign="top"|Values |
|valign="top"|Pointeur | |valign="top"|Pointeur | ||
|valign="top"|[[File:in.png|caption]] | |valign="top"|[[File:in.png|caption]] | ||
|valign="top" align="center"|6 | |valign="top" align="center"|6 | ||
| − | | | + | |Pointer to the array (real) to values corresponding to each ID to calculate the color based on limits |
|- | |- | ||
| − | | | + | |Result |
|Image | |Image | ||
|[[File:out.png|caption]] | |[[File:out.png|caption]] | ||
|valign="top" align="center"|7 | |valign="top" align="center"|7 | ||
| − | |Image | + | |Image including SVG code |
|} | |} | ||
Version du 2 juillet 2014 à 20:39
Component Command List - Version française
Parameters
| Parameters | Type | Parameter # | Description | |
|---|---|---|---|---|
| Name of Graph's parameters | Pointer | 1 | Pointer to a text array that contains the name of the parameters, this array must have the same size as the array of parameter values of the graph
Possible values of the parameter of the graph are the following:
General parameters of the graph
| |
| Parameter values of the graph | pointeur | 2 | Pointer to the text array of parameter values this array must be the same size as the previous
| |
| Limits | Pointeur | 3 | Pointer to the array (real) of limit values of level of values | |
| Colors | Pointeur | 4 | Pointer to the array (text) colors to be applied to the representation, you must define one more color than you have specified limit values | |
| ZoneID | Pointeur | 5 | Pointer to the array (text) ID table zones to set color | |
| Values | Pointeur | 6 | Pointer to the array (real) to values corresponding to each ID to calculate the color based on limits | |
| Result | Image | 7 | Image including SVG code |
Description
This command allows colorizing a base map function of values and color gradients.
Zones are listed by their ID and manipulated from thereof.
Code example

 // User (OS) : Paul Kuhn - BlueCompany
 // Date  : 08/11/13, 10:42:04
 // ----------------------------------------------------
 // Method : Exemple_carte1
 // Description
 //
 //
 // Parameters
 // ----------------------------------------------------

TABLEAU TEXTE($DataGrapheName;0)
TABLEAU TEXTE($DataGraphe;0)
AJOUTER A TABLEAU($DataGrapheName;"Title")
AJOUTER A TABLEAU($DataGraphe;"Répartition géographique des ventes")  // 1 - Titre du graphe

AJOUTER A TABLEAU($DataGrapheName;"SVGFile")
AJOUTER A TABLEAU($DataGraphe;"Fond_de_carte_France"+Séparateur dossier+"departements.svg")

AJOUTER A TABLEAU($DataGrapheName;"GraphFont")
AJOUTER A TABLEAU($DataGraphe;"Arial")  // Police des légendes et des échelles

AJOUTER A TABLEAU($DataGrapheName;"GraphBGColor")
AJOUTER A TABLEAU($DataGraphe;"LightBlue:30")  // Couleur du fond

AJOUTER A TABLEAU($DataGrapheName;"ShowLegend")
AJOUTER A TABLEAU($DataGraphe;"Oui")  // Affichage de la légende

AJOUTER A TABLEAU($DataGrapheName;"LegendLanguage")
AJOUTER A TABLEAU($DataGraphe;"English")  // Affichage de la légende

TABLEAU REEL($valeur_limite;3)
$valeur_limite{1}:=30
$valeur_limite{2}:=60
$valeur_limite{3}:=90

TABLEAU TEXTE($couleur;3)
$couleur{0}:="aquamarine"
$couleur{1}:="deepskyblue"
$couleur{2}:="dodgerblue"
$couleur{3}:="midnightblue"

TABLEAU REEL($Value;95)
TABLEAU TEXTE($ZoneID;95)
Boucle ($i;1;95)
$ZoneID{$i}:=Chaine($i;"00")
$Value{$i}:=(Hasard%(101))
Fin de boucle
$ZoneID{20}:="2A"
INSERER DANS TABLEAU($ZoneID;21;1)
$ZoneID{21}:="2B"
INSERER DANS TABLEAU($Value;21;1)
$Value{21}:=$Value{20}

TheGraphe:=SGR_DrawMap (->$DataGrapheName;->$DataGraphe;->$valeur_limite;->$couleur;->$ZoneID;->$Value)
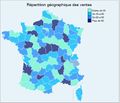
Image corresponding to the sample code above