SGR Generate Pie-EN : Différence entre versions
De BlueWiki
(→Exemple de code) |
(→Sample Code) |
||
| Ligne 74 : | Ligne 74 : | ||
For this graph you will need to use the code below | For this graph you will need to use the code below | ||
| − | // | + | // User (OS) : Paul Kuhn - BlueCompany |
// ---------------------------------------------------- | // ---------------------------------------------------- | ||
| − | // | + | // Method : Pie_Sample |
| + | |||
| + | // Definition of generic parameters of the graph | ||
| + | ARRAY TEXT($DataGrapheName;0) | ||
| + | ARRAY TEXT($DataGraphe;0) | ||
| + | APPEND TO ARRAY($DataGrapheName;"Title") | ||
| + | APPEND TO ARRAY($DataGraphe;"Revenue by state") // title (not shown if empty) | ||
| + | APPEND TO ARRAY($DataGrapheName;"GraphBGColor") | ||
| + | APPEND TO ARRAY($DataGraphe;"White") // BackGround color | ||
| + | APPEND TO ARRAY($DataGrapheName;"GraphFont") | ||
| + | APPEND TO ARRAY($DataGraphe;"times") // Font | ||
| + | APPEND TO ARRAY($DataGrapheName;"ShowLegend") // Echelles des valeurs | ||
| + | APPEND TO ARRAY($DataGraphe;"true") // vrai/faux ou true/false | ||
| + | APPEND TO ARRAY($DataGrapheName;"TitleAlignement") // Title alignment | ||
| + | APPEND TO ARRAY($DataGraphe;String(Center)) | ||
| − | + | ARRAY TEXT(Legende;6) | |
| − | + | Legende{1}:="California" | |
| − | + | Legende{2}:="Texas" | |
| − | + | Legende{3}:="Florida" | |
| − | + | Legende{4}:="South carolina" | |
| + | Legende{5}:="Michigan" | ||
| + | Legende{6}:="Others" | ||
| − | + | ARRAY REAL(ValueC;6) | |
| − | + | For ($i;1;6) | |
| + | ValueC{$i}:=(Random%(101)) | ||
| + | End for | ||
| − | + | ARRAY TEXT(color;6) | |
| − | + | color{1}:="lightsteelblue" | |
| − | + | color{2}:="pink" | |
| − | + | color{3}:="chocolate" | |
| − | + | color{4}:="darksalmon" | |
| − | + | color{5}:="red" | |
| − | + | color{6}:="green" | |
| − | + | TheGraphe:=SGR_Generate_Pie (->$DataGrapheName;->$DataGraphe;->Legende;->ValueC;->color) | |
| − | + | ||
| − | + | ||
| − | + | ||
| − | + | ||
| − | + | ||
| − | + | ||
| − | + | ||
| − | + | ||
| − | + | ||
| − | + | ||
| − | + | ||
| − | + | ||
| − | + | ||
| − | + | ||
| − | + | ||
| − | + | ||
| − | + | ||
| − | + | ||
| − | + | ||
| − | + | ||
| − | + | ||
| − | + | ||
| − | TheGraphe:=SGR_Generate_Pie (->$DataGrapheName;->$DataGraphe;->Legende;->ValueC;-> | + | |
Version du 8 décembre 2013 à 02:26
Parameters
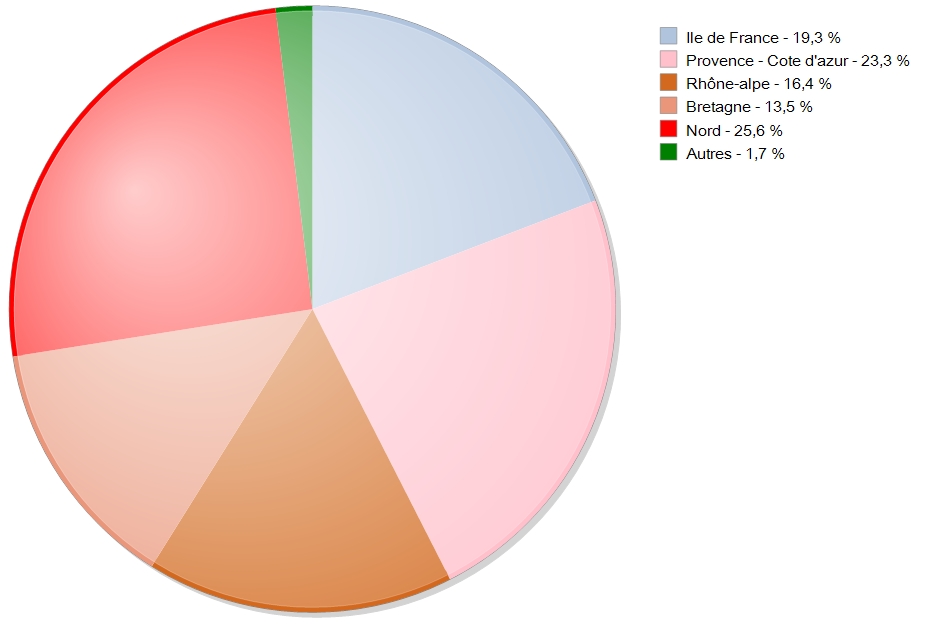
Description
This graph will be completely reviewed in the next version
The next version will allow you to detach an area and give perspective and depth to the graph
Sample Code
For this graph you will need to use the code below
 // User (OS) : Paul Kuhn - BlueCompany
 // ----------------------------------------------------
 // Method : Pie_Sample
 // Definition of generic parameters of the graph
ARRAY TEXT($DataGrapheName;0)
ARRAY TEXT($DataGraphe;0)
APPEND TO ARRAY($DataGrapheName;"Title")
APPEND TO ARRAY($DataGraphe;"Revenue by state")  // title (not shown if empty)
APPEND TO ARRAY($DataGrapheName;"GraphBGColor")
APPEND TO ARRAY($DataGraphe;"White")  // BackGround color
APPEND TO ARRAY($DataGrapheName;"GraphFont")
APPEND TO ARRAY($DataGraphe;"times")  // Font
APPEND TO ARRAY($DataGrapheName;"ShowLegend")  // Echelles des valeurs
APPEND TO ARRAY($DataGraphe;"true")  // vrai/faux ou true/false
APPEND TO ARRAY($DataGrapheName;"TitleAlignement")  // Title alignment
APPEND TO ARRAY($DataGraphe;String(Center))

ARRAY TEXT(Legende;6)
Legende{1}:="California"
Legende{2}:="Texas"
Legende{3}:="Florida"
Legende{4}:="South carolina"
Legende{5}:="Michigan"
Legende{6}:="Others"

ARRAY REAL(ValueC;6)
For ($i;1;6)
ValueC{$i}:=(Random%(101))
End for

ARRAY TEXT(color;6)
color{1}:="lightsteelblue"
color{2}:="pink"
color{3}:="chocolate"
color{4}:="darksalmon"
color{5}:="red"
color{6}:="green"
TheGraphe:=SGR_Generate_Pie (->$DataGrapheName;->$DataGraphe;->Legende;->ValueC;->color)
