|
|
| Ligne 47 : |
Ligne 47 : |
| | * - "ShowValue" or "Affichage des valeurs" (oui/yes/non/no/value/name/%) : Displays the title, value or percentage of each part of the pie | | * - "ShowValue" or "Affichage des valeurs" (oui/yes/non/no/value/name/%) : Displays the title, value or percentage of each part of the pie |
| | * - "Donut" Number of pixels of diameter of central extrusion : the white circle (Our advice: between 300 and 500) | | * - "Donut" Number of pixels of diameter of central extrusion : the white circle (Our advice: between 300 and 500) |
| − | | + | * - "reflection" : Displaying the reflection effect on the graph (yes / no) By default reflection is displayed. This is useful for PDF generation because of a bug on Macintosh (4D or driver), you may get a completely black graph. |
| | | | |
| | |- | | |- |
Version du 16 novembre 2014 à 20:28
Component Command List
Version française de cette page
Parameters
| Parameter
|
Type
|
|
Parameter #
|
Description
|
| Name of Graph's parameters
|
Pointer
|

|
1
|
Pointer to a text array that contains the name of the parameters, this array must have the same size as the array of parameter values of the graph
Possible values of the parameter of the graph are the following:
Title parameters
- - "Titre" or "Title" : graph title
- - "alignement du titre" or "TitleAlignement" : Title Alignment 0,1,2,3
- - "Police du graphe" or "GraphFont" : Title font and default font for legend and scale (arial by default)
- - "TitleFontSize" or "Taille de la police du titre" : Title font size
- - "TitleFontStyle" or "Style de la police du titre" : Title font style (ex (bold+italic))
- - "TitleVerticalOffSet" : Vertical Offset of the title in px
Legend parameters
- - "Affichage de la légende" or "ShowLegend" : Display the legend "oui", "vrai", "true", "yes", "non", "no", "Faux", "false"
- - "Police de la légende" ou "legendFont" : Legend font, if this value is passed, it replaces the "graphFont"
- - "LegendFontSize" or "Taille de la police de la légende" : Legend font size
- - "LegendFontStyle" or "Style de la police de la légende" : Legend font style
- - "LegendFontColor" or "Couleur de la police de la légende" : Legend font color
- - "LegendBGcolor" or "Couleur de fond de la légende" : Legend background color ("White:0" for transparency)
Value parameters
- - "ValueFontSize" or "Taille de la police des valeurs" : Font size of the displayed values on the graph
General parameters
- - "ShowValue" or "Affichage des valeurs" (oui/yes/non/no/value/name/%) : Displays the title, value or percentage of each part of the pie
- - "Donut" Number of pixels of diameter of central extrusion : the white circle (Our advice: between 300 and 500)
- - "reflection" : Displaying the reflection effect on the graph (yes / no) By default reflection is displayed. This is useful for PDF generation because of a bug on Macintosh (4D or driver), you may get a completely black graph.
|
| Parameter values of the graph
|
Pointer
|

|
2
|
Pointer to the array of parameter values this array must be the same size as the previous
|
| Part names
|
Pointer
|

|
3
|
Pointer to an array (type: text) of the names of portions of pie chart
|
| Values
|
Pointer
|

|
4
|
Pointer to an array (type: real) of part values of pie chart
|
| Colors
|
Pointer
|

|
5
|
Pointer to an array (type: text) of colors of the parts of pie chart
|
| Parameters of the parts of pie
|
Pointer
|

|
6
|
Pointer to an array (type: text) of parameters of the parts of pie.
This parameter exists since version 1.2 and is optional, it is used to define the specific parameters of a portion of pie
Example: "range of extraction=100&ShowTheValue=no" will shift part of pie chart outward 100px and will not display the value of this part even if the general view is requested
|
| Graph
|
Picture
|

|
|
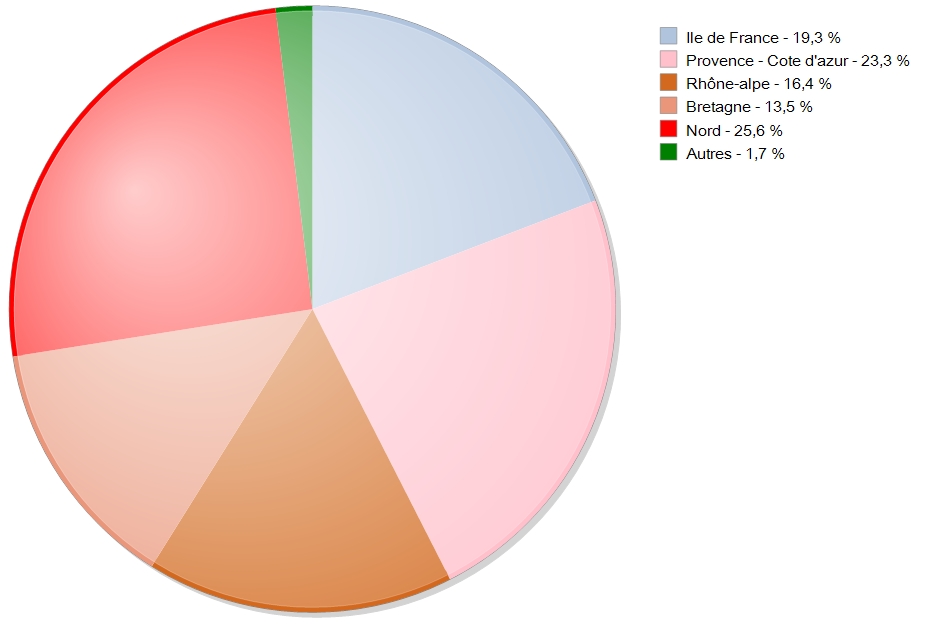
Picture including the SVG code
|
Description
This graph will be completely reviewed in the next version
The next version will allow you to detach an area and give perspective and depth to the graph
Sample Code

For this graph you will need to use the code below
 // User (OS) : Paul Kuhn - BlueCompany
 // ----------------------------------------------------
 // Method : Pie_Sample

 // Definition of generic parameters of the graph
ARRAY TEXT($DataGrapheName;0)
ARRAY TEXT($DataGraphe;0)
APPEND TO ARRAY($DataGrapheName;"Title")
APPEND TO ARRAY($DataGraphe;"Revenue by state")  // title (not shown if empty)
APPEND TO ARRAY($DataGrapheName;"GraphBGColor")
APPEND TO ARRAY($DataGraphe;"White")  // BackGround color
APPEND TO ARRAY($DataGrapheName;"GraphFont")
APPEND TO ARRAY($DataGraphe;"times")  // Font
APPEND TO ARRAY($DataGrapheName;"ShowLegend")  // Echelles des valeurs
APPEND TO ARRAY($DataGraphe;"true")  // vrai/faux ou true/false
APPEND TO ARRAY($DataGrapheName;"TitleAlignement")  // Title alignment
APPEND TO ARRAY($DataGraphe;String(Center))

ARRAY TEXT(Legende;6)
Legende{1}:="California"
Legende{2}:="Texas"
Legende{3}:="Florida"
Legende{4}:="South carolina"
Legende{5}:="Michigan"
Legende{6}:="Others"

ARRAY REAL(ValueC;6)
For ($i;1;6)
ValueC{$i}:=(Random%(101))
End for

ARRAY TEXT(color;6)
color{1}:="lightsteelblue"
color{2}:="pink"
color{3}:="chocolate"
color{4}:="darksalmon"
color{5}:="red"
color{6}:="green"
TheGraphe:=SGR_Generate_Pie (->$DataGrapheName;->$DataGraphe;->Legende;->ValueC;->color)
