SGR Generate Pie-EN : Différence entre versions
De BlueWiki
(→Parameters) |
|||
| (5 révisions intermédiaires par un utilisateur sont masquées) | |||
| Ligne 22 : | Ligne 22 : | ||
Possible values of the parameter of the graph are the following: | Possible values of the parameter of the graph are the following: | ||
| − | Title parameters | + | '''Title parameters''' |
| − | * | + | * "Titre" or "Title" : graph title |
| − | * | + | * "TitleAlignement" or "alignement du titre" : Title Alignment 0,1,2,3 |
| − | * | + | * "Police du graphe" or "GraphFont" : Title font and default font for legend and scale (arial by default) |
| − | * | + | * "TitleFontSize" or "Taille de la police du titre" : Title font size |
| − | * | + | * "TitleFontStyle" or "Style de la police du titre" : Title font style (ex (bold+italic)) |
| − | * | + | * "TitleVerticalOffSet" : Vertical Offset of the title in px |
| − | Legend parameters | + | '''Legend parameters''' |
| − | * | + | * "ShowLegend" or "Affichage de la légende" : Display the legend "oui", "vrai", "true", "yes", "non", "no", "Faux", "false" |
| − | * | + | * "legendFont" or "Police de la légende" : Legend font, if this value is passed, it replaces the "graphFont" |
| − | * | + | * "LegendFontSize" or "Taille de la police de la légende" : Legend font size |
| − | * | + | * "LegendFontStyle" or "Style de la police de la légende" : Legend font style |
| − | * | + | * "LegendFontColor" or "Couleur de la police de la légende" : Legend font color |
| − | * | + | * "LegendBGcolor" or "Couleur de fond de la légende" : Legend background color ("White:0" for transparency) |
| − | |||
| − | |||
| − | |||
| + | '''Value parameters''' | ||
| + | * "ShowValue" or "Affichage des valeurs" (oui/yes/non/no/value/name/%) : Displays the title, value or percentage of each part of the pie | ||
| + | * "ValueFont" or "Police des valeurs" : Font of the displayed values on the graph | ||
| + | * "ValueFontSize" or "Taille de la police des valeurs" : Font size of the displayed values on the graph | ||
| + | * "ValueFontStyle" or "Style de la police des valeurs" : Font style of the displayed values on the graph | ||
| + | * "ValueFontColor" or "Couleur de la police des valeurs" : Font color of the displayed values on the graph | ||
| + | * "ValueFormat" or "Format des valeurs" : Format string values in 4D format (eg. "### ## 0.00%") | ||
| + | |||
| + | |||
| + | '''General parameters''' | ||
| + | * "Donut" Number of pixels of diameter of central extrusion : the white circle (Our advice: between 300 and 500) | ||
| + | * "reflection" : Displaying the reflection effect on the graph (yes / no) By default reflection is displayed. This is useful for PDF generation because of a bug on Macintosh (4D or driver), you may get a completely black graph. | ||
|- | |- | ||
Version actuelle en date du 1 décembre 2014 à 08:09
Version française de cette page
[modifier] Parameters
[modifier] Description
This graph will be completely reviewed in the next version
The next version will allow you to detach an area and give perspective and depth to the graph
[modifier] Sample Code
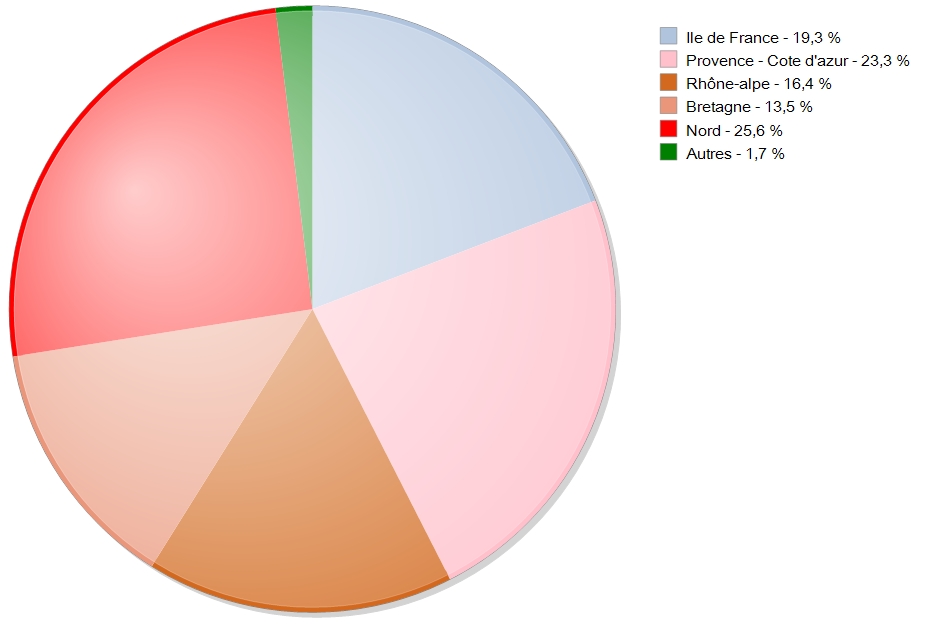
For this graph you will need to use the code below
 // User (OS) : Paul Kuhn - BlueCompany
 // ----------------------------------------------------
 // Method : Pie_Sample

 // Definition of generic parameters of the graph
ARRAY TEXT($DataGrapheName;0)
ARRAY TEXT($DataGraphe;0)
APPEND TO ARRAY($DataGrapheName;"Title")
APPEND TO ARRAY($DataGraphe;"Revenue by state")  // title (not shown if empty)
APPEND TO ARRAY($DataGrapheName;"GraphBGColor")
APPEND TO ARRAY($DataGraphe;"White")  // BackGround color
APPEND TO ARRAY($DataGrapheName;"GraphFont")
APPEND TO ARRAY($DataGraphe;"times")  // Font
APPEND TO ARRAY($DataGrapheName;"ShowLegend")  // Echelles des valeurs
APPEND TO ARRAY($DataGraphe;"true")  // vrai/faux ou true/false
APPEND TO ARRAY($DataGrapheName;"TitleAlignement")  // Title alignment
APPEND TO ARRAY($DataGraphe;String(Center))

ARRAY TEXT(Legende;6)
Legende{1}:="California"
Legende{2}:="Texas"
Legende{3}:="Florida"
Legende{4}:="South carolina"
Legende{5}:="Michigan"
Legende{6}:="Others"

ARRAY REAL(ValueC;6)
For ($i;1;6)
ValueC{$i}:=(Random%(101))
End for

ARRAY TEXT(color;6)
color{1}:="lightsteelblue"
color{2}:="pink"
color{3}:="chocolate"
color{4}:="darksalmon"
color{5}:="red"
color{6}:="green"
TheGraphe:=SGR_Generate_Pie (->$DataGrapheName;->$DataGraphe;->Legende;->ValueC;->color)
